Monitoring & Observability
CertChain includes comprehensive monitoring through ArgoCD for deployment management and Grafana for runtime metrics.
ArgoCD — GitOps Dashboard
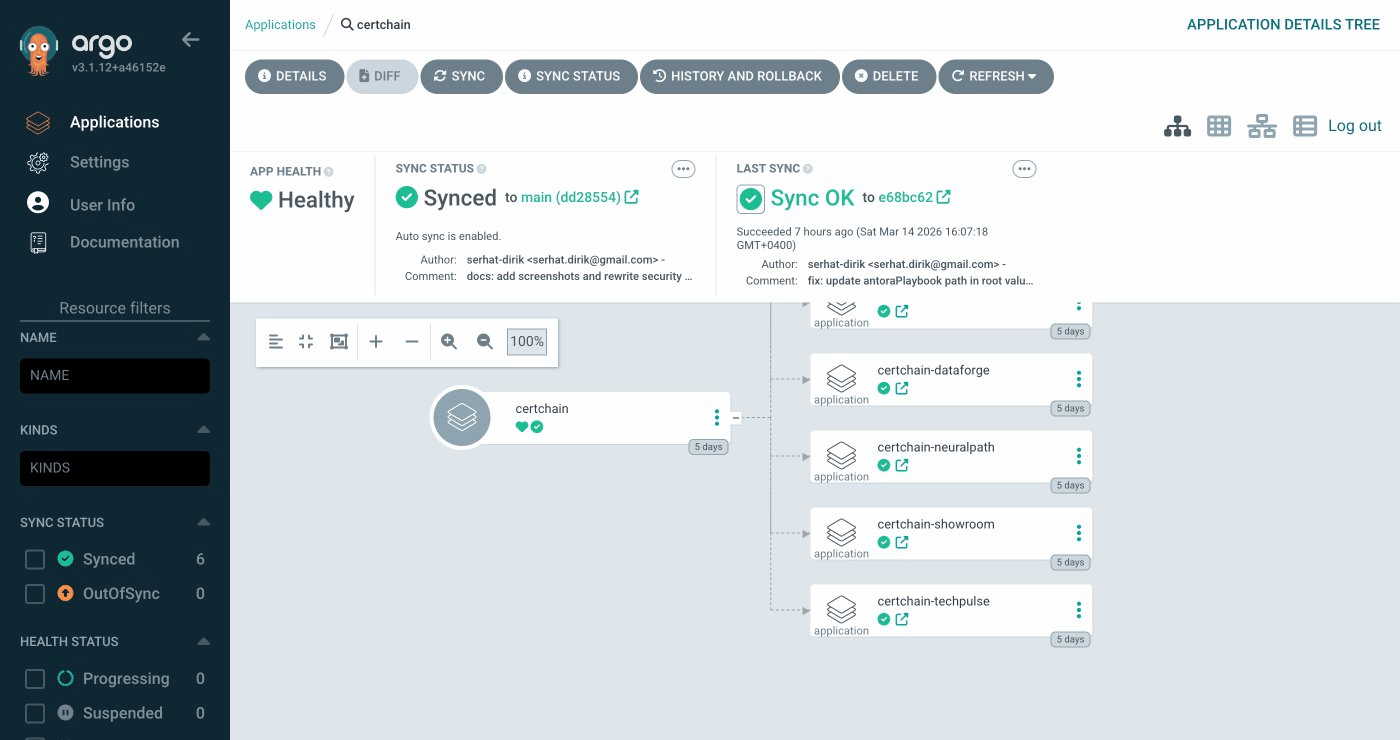
CertChain is deployed via ArgoCD using the App-of-Apps pattern. A single root Application generates all child Applications automatically.
Access ArgoCD
Navigate to ArgoCD: Open
Click Log in via OpenShift and use the OpenShift admin credentials from the Reference section.
|
You can also log in with |
ArgoCD Applications
You should see 6 Applications, all Synced and Healthy:
| Application | Description |
|---|---|
field-content (or certchain on BYO clusters) |
Root App-of-Apps — generates the child Applications from Helm bootstrap chart |
certchain-central |
Central infrastructure: Fabric CA, orderer0, cert-portal, verify-api, Keycloak, Grafana, identity brokering, demo data seed |
certchain-techpulse |
TechPulse org: peer0, orderer, CouchDB, cert-admin-api, course-manager-ui, certcontract (CcaaS), Keycloak |
certchain-dataforge |
DataForge org: same layout as TechPulse |
certchain-neuralpath |
NeuralPath org: same layout as TechPulse |
certchain-showroom |
This lab guide (deployed to |
Click any Application to explore its resource tree, sync status, and sync-wave ordering. The sync waves ensure resources are created in the correct order — for example, Fabric CA must be running before enrollment jobs can execute.
Grafana — Metrics Dashboards
Navigate to Grafana: Open
Grafana is configured with anonymous access — no login required.
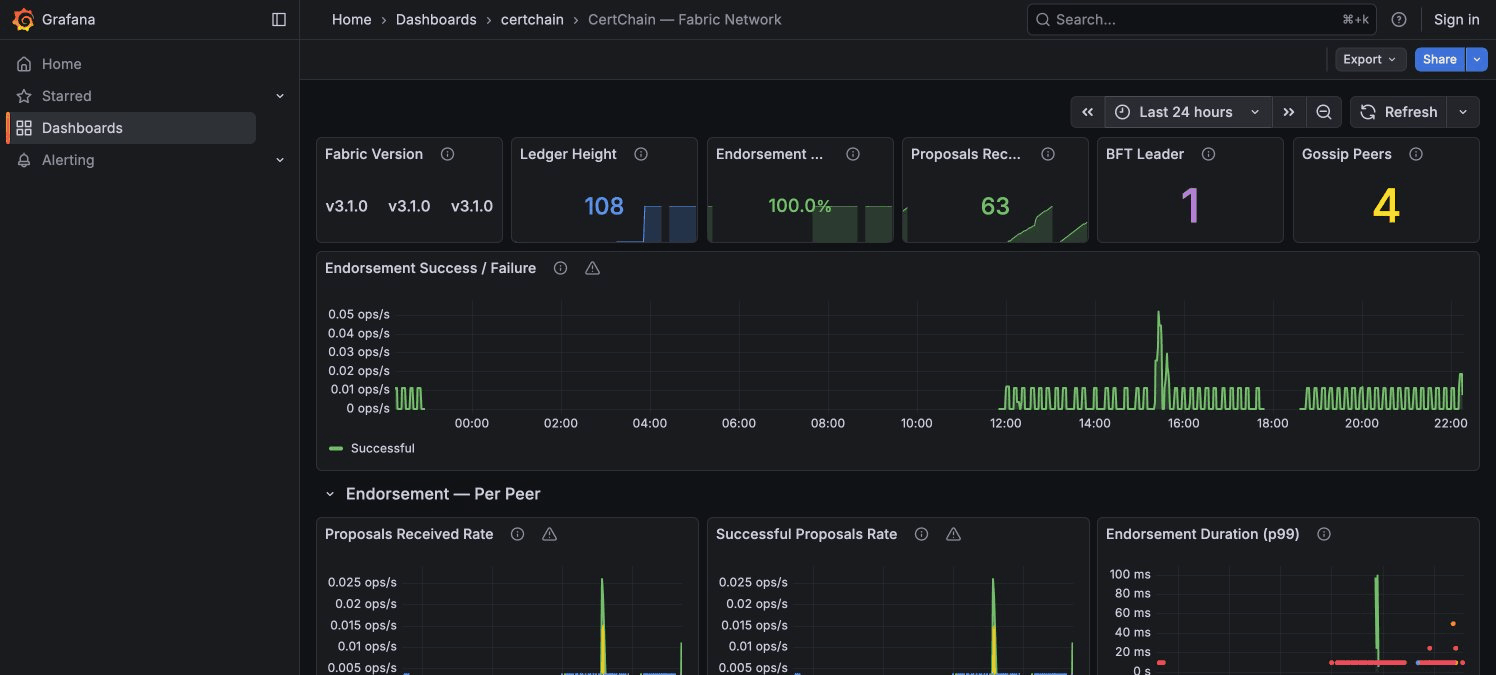
Fabric Network Dashboard
Select CertChain — Fabric Network from the dashboard list.
Key things to look for:
-
Ledger Height — Current block count. All peers and orderers should show the same value.
-
BFT Leader + Network Nodes table — Shows which orderer is the current consensus leader. The node mapping table tells you who each node ID belongs to (node 0 = orderer0 in central, node 1 = orderer in techpulse, etc.).
-
Gossip Peers (per Org) — Each peer should see 2 remote peers (the other 2 orgs). If any org shows 0, gossip is broken.
-
Endorsement Success % — Should be close to 100% in normal operation.
-
SmartBFT Consensus section — The Consensus View table shows all orderers agreeing on the same view number and leader.
Generating Traffic
The dashboards are more interesting with live data. Run this script to issue and verify certificates rapidly across all three organizations:
# Generate traffic across all 3 orgs
for ORG in techpulse dataforge neuralpath; do
  KC_URL="https://keycloak-certchain-$ORG."
  API_URL="https://cert-admin-api-certchain-$ORG."

  TOKEN=$(curl -sk -X POST "$KC_URL/realms/$ORG/protocol/openid-connect/token" \
    -d "grant_type=password" -d "client_id=course-manager-ui" \
    -d "username=admin@$ORG.demo" -d "password=admin" \
    | python3 -c "import sys,json; print(json.load(sys.stdin)['access_token'])" 2>/dev/null)

  if [ -z "$TOKEN" ]; then
    echo "  ERROR: Could not get token for $ORG"
    continue
  fi

  for i in $(seq 1 5); do
    CERT_ID="TRAFFIC-$ORG-$(date +%s)-$i"
    curl -sk -X POST "$API_URL/api/v1/certificates" \
      -H "Authorization: Bearer $TOKEN" \
      -H "Content-Type: application/json" \
      -d "{\"certID\":\"$CERT_ID\",\"studentID\":\"student01@$ORG.demo\",\"studentName\":\"Traffic Test\",\"courseID\":\"LOAD-101\",\"courseName\":\"Load Test\",\"issueDate\":\"2026-03-16\",\"expiryDate\":\"2027-03-16\"}" \
      -o /dev/null -w "  $ORG cert $i: HTTP %{http_code}\n"
  done
done
echo "Done! Check Grafana — metrics appear within 30 seconds."
After running, switch to the Grafana dashboard and watch:
-
Endorsement Success/Failure timeline shows a burst of activity
-
Proposals Received Rate per peer shows spikes across all 3 organizations
-
SmartBFT Batch Processing Latency shows the consensus overhead per block